Tableau Market Basket Analysis
Imagine being able to uncover hidden patterns and insights within your data, allowing you to make more informed business decisions. With Tableau Market Basket Analysis, this is now possible. This innovative tool utilizes advanced algorithms to analyze customer purchasing patterns and identify associations between products. By understanding which items are frequently purchased together, businesses can optimize their pricing strategies, improve cross-selling opportunities, and enhance overall customer satisfaction. Say goodbye to guesswork and hello to data-driven success with Tableau Market Basket Analysis.

Table of Contents
Introduction to Tableau Market Basket Analysis
Definition of Market Basket Analysis
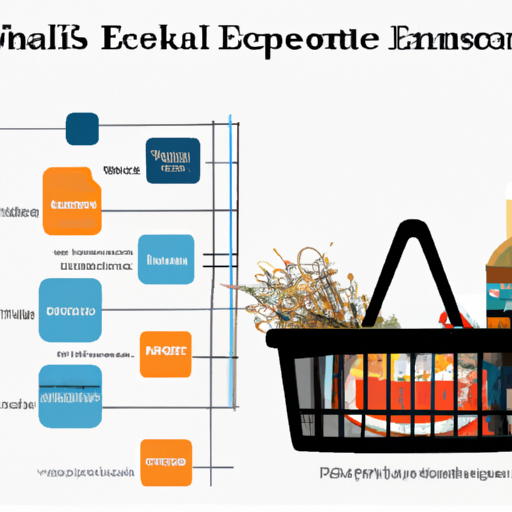
Market Basket Analysis (MBA) is a data mining technique used to identify patterns and relationships between items that are frequently purchased together. It is based on the concept that customers who buy a certain product are likely to buy another product as well. By analyzing customer transaction data, MBA helps businesses understand customer behavior, make data-driven decisions, and improve business strategies.
Importance and Applications of Market Basket Analysis
Market Basket Analysis is a valuable tool for various industries, including retail, e-commerce, hospitality, and supermarkets. By understanding customer purchase patterns and associations, businesses can identify cross-selling opportunities, optimize product placement, enhance pricing strategies, and improve overall customer satisfaction. MBA provides insights that can drive revenue growth, increase customer loyalty, and support effective marketing campaigns.
Introduction to Tableau
Tableau is a powerful data visualization and business intelligence tool that helps organizations transform raw data into meaningful insights. It enables users to connect to various data sources, create interactive dashboards, and share insights with others. Tableau Market Basket Analysis leverages the capabilities of Tableau to perform advanced analytics, explore associations between items, and visualize patterns in customer purchasing behavior.
Understanding Market Basket Analysis
Concept of Market Basket
The concept of a market basket refers to a collection of items that are purchased by a customer in a single transaction. It represents the combination of products that a customer puts into their virtual or physical shopping cart. Analyzing market baskets helps businesses understand the relationships between these items and identify patterns, which can guide decision-making and drive business growth.
Association Rules and Support
Association rules in Market Basket Analysis describe the relationships between items based on their co-occurrence in transactions. These rules are represented in the format “If X, then Y,” where X and Y are sets of items. The support of an association rule represents the frequency of the rule occurring in the dataset. A higher support value indicates a stronger relationship between the items, while a lower support value indicates a weaker relationship.
Frequent Itemsets
Frequent itemsets are sets of items that appear together in transactions above a specified minimum support threshold. These itemsets are crucial in Market Basket Analysis as they provide insights into commonly purchased combinations of items. By identifying frequent itemsets, businesses can understand customer preferences, plan promotions, and optimize product offerings.
Apriori Algorithm
The Apriori algorithm is a popular method used to mine frequent itemsets in Market Basket Analysis. It works by iteratively discovering itemsets that satisfy minimum support thresholds. The algorithm starts by finding frequent single items, then generates larger itemsets based on the discovered frequent itemsets. The Apriori algorithm efficiently uncovers associations between items and plays a vital role in MBA.
Benefits of Market Basket Analysis
Identifying Cross-Selling Opportunities
Market Basket Analysis helps businesses identify cross-selling opportunities by uncovering associations between products. By understanding which items are frequently purchased together, businesses can strategically bundle products or recommend complementary items to customers. This not only increases sales revenue but also enhances the overall customer experience.
Improving Product Placement
By analyzing market baskets, businesses gain insights into how customers navigate their product offerings. This information can be used to optimize product placement, both online and in physical stores. Placing related items together encourages customers to consider additional purchases, leading to increased basket sizes and higher revenues.
Optimizing Pricing Strategies
Market Basket Analysis allows businesses to observe how various product combinations affect customer behavior. This insight enables them to optimize pricing strategies by identifying items that are frequently purchased together at different price points. By adjusting prices strategically, businesses can maximize revenue and price sensitivity without negatively impacting customer satisfaction.
Enhancing Customer Satisfaction
Understanding customer preferences and purchase patterns through Market Basket Analysis allows businesses to personalize their offerings and improve customer satisfaction. By tailoring promotions, recommendations, and product offerings based on customer behavior, businesses can create a more personalized and engaging shopping experience. This not only increases customer loyalty but also drives repeat purchases.

Collecting and Preparing Data for Analysis
Data Collection Methods
To perform Market Basket Analysis, businesses need transactional data that captures customer purchases. Data can be collected from various sources, including point-of-sale systems, e-commerce platforms, loyalty programs, and customer surveys. The data should include information such as transaction ID, customer ID, and product details. It is essential to ensure data integrity and accuracy throughout the data collection process.
Data Preprocessing Techniques
Before analyzing the data, it is necessary to preprocess and clean it to eliminate errors and inconsistencies. Data preprocessing techniques involve removing duplicate transactions, handling missing values, and dealing with outliers. Data normalization and standardization may also be necessary to ensure accurate analysis and meaningful insights.
Cleaning and Transforming Data
Data cleaning involves identifying and rectifying errors, inconsistencies, or missing values in the dataset. It may involve techniques such as error detection, data imputation, and outlier handling. Transforming data into a suitable format for analysis is also essential. This may include aggregating data at the transaction level, creating binary or categorical variables, and creating itemsets from transactional data.
Creating Transactional Data Structures
To perform Market Basket Analysis, data needs to be structured in a transactional format. This involves creating a table where each row represents a transaction and each column represents a product or item. The cells in the table indicate whether the item was purchased in the transaction or not. This transactional data structure enables the identification of frequent itemsets and the generation of association rules.
Performing Market Basket Analysis in Tableau
Importing Data into Tableau
To perform Market Basket Analysis in Tableau, users need to import the preprocessed transactional data into the software. Tableau supports various data sources, including CSV files, Excel spreadsheets, databases, and online data connectors. Importing data into Tableau is a straightforward process that involves selecting the appropriate data source and specifying the data range or file location.
Creating Calculated Fields
Calculated fields in Tableau are custom formulas or expressions that users can create to perform calculations based on their data. In Market Basket Analysis, calculated fields are used to generate association rules, measure support, confidence, and lift, and perform other calculations related to analyzing customer purchase patterns. Tableau provides a user-friendly interface for creating and managing calculated fields.
Building Association Rules
In Tableau, association rules can be built using the “Create Calculated Field” feature and writing the appropriate logic based on the concept of “if X, then Y.” By specifying the conditions and criteria for itemsets, Tableau can generate association rules that describe the relationships between different items. These association rules provide valuable insights into customer behavior and purchasing patterns.
Choosing Support and Confidence Thresholds
To improve the accuracy and relevance of association rules, users need to set support and confidence thresholds. The support threshold represents the minimum frequency an itemset must occur to be considered frequent. The confidence threshold determines the minimum level at which an association rule is considered significant. These thresholds can be adjusted to fine-tune the analysis and generate more meaningful insights.
Visualizing Association Rules
Tableau offers a wide range of data visualization options to present association rules in a comprehensible manner. Users can create various visualizations, such as bar charts, scatter plots, and network diagrams, to visualize the relationships between items and highlight patterns in customer behavior. Visualizing association rules allows users to explore data visually and gain deeper insights into customer purchase patterns.
Interpreting and Analyzing Results
Understanding Association Rules
Interpreting association rules involves analyzing the generated rules to extract meaningful insights. Each association rule consists of an antecedent (X) and a consequent (Y), where items in X are predictors of items in Y. By understanding the composition of the antecedent and consequent, businesses can identify which items are associated and make informed business decisions based on these associations.
Measuring Support, Confidence, and Lift
Support, confidence, and lift are metrics used to measure the strength and significance of association rules. Support measures the frequency of occurrence of an itemset, confidence measures the likelihood that the consequent occurs given the antecedent, and lift measures the level of dependence between the antecedent and consequent. These metrics help businesses identify strong associations and prioritize actionable insights.
Identifying Strong Associations
By examining support, confidence, and lift values, businesses can identify strong associations that have the potential to drive revenue or improve business strategies. High support indicates popular itemsets, high confidence signifies strong associations between items, and lift values greater than 1 indicate positive relationships. By focusing on strong associations, businesses can make targeted decisions for cross-selling, promotional campaigns, and product placement.
Exploring Patterns and Insights
Market Basket Analysis in Tableau enables users to explore patterns and gain meaningful insights into customer behavior. By visualizing association rules and analyzing metrics, users can identify trends, seasonal patterns, and customer preferences. Exploring patterns and insights helps businesses understand customer needs, optimize marketing strategies, and improve the overall customer experience.
Improving Market Basket Analysis in Tableau
Refining Data Preparation Techniques
Continuous refinement of data preparation techniques is crucial for accurate and reliable Market Basket Analysis. This involves exploring different methods for handling missing values, outliers, and data cleansing. Constant monitoring and improvement of data quality and integrity ensure that the analysis is based on accurate and meaningful information.
Optimizing the Apriori Algorithm
The Apriori algorithm is a fundamental component of Market Basket Analysis, and optimizing its performance can lead to more efficient and accurate results. Techniques such as pruning infrequent itemsets, utilizing parallel processing, or leveraging advanced algorithms can significantly enhance the speed and performance of Apriori. Optimizing the Apriori algorithm streamlines the analysis process and allows businesses to derive insights faster.
Iterative Analysis and Fine-tuning
Market Basket Analysis is an iterative process that involves multiple iterations of data analysis and refinement. By performing iterative analysis, businesses can fine-tune their market basket insights, identify additional associations, and uncover evolving customer behavior. Regularly refining the analysis based on new data and adjusting support and confidence thresholds helps businesses keep up with changing patterns and behaviors.
Leveraging Advanced Tableau Features
Tableau offers advanced features and functionalities that can further enhance Market Basket Analysis. This includes using predictive analytics techniques, leveraging machine learning algorithms for automated insights generation, and implementing advanced visualization techniques such as network analysis or geospatial analysis. By exploring and utilizing these advanced Tableau features, businesses can unlock additional insights and make more informed decisions.
Case Studies and Real-world Examples
Retail Industry
In the retail industry, Market Basket Analysis helps retailers understand customer behavior, optimize product offerings, and increase cross-selling opportunities. By analyzing customer purchase patterns, retailers can bundle products, personalize recommendations, and strategically place related items to drive additional sales. Market Basket Analysis has been successfully implemented by major retailers to improve customer satisfaction and increase revenue.
E-commerce Sector
In the e-commerce sector, where personalized recommendations are crucial, Market Basket Analysis plays a vital role in improving customer experience and increasing sales. E-commerce platforms leverage Market Basket Analysis to recommend complementary products, personalize product suggestions, and implement targeted cross-selling campaigns. By understanding customer preferences and associations, e-commerce businesses can boost customer engagement and loyalty.
Hospitality and Tourism
Market Basket Analysis is also valuable in the hospitality and tourism industry. Hotels, resorts, and travel agencies use this technique to identify patterns in customer booking behavior, recommend complementary services, and optimize pricing strategies. By leveraging Market Basket Analysis, businesses in the hospitality sector can enhance their revenue management strategies and provide personalized experiences based on customer preferences.
Supermarkets and Grocery Stores
Market Basket Analysis has long been used by supermarkets and grocery stores to optimize product placement, increase cross-selling opportunities, and improve inventory management. By analyzing transactional data, these businesses can identify popular combinations of products, plan promotions and discounts, and optimize customer flow within stores. Market Basket Analysis helps supermarkets and grocery stores maximize revenue and provide a seamless shopping experience.
Challenges and Limitations
Data Quality and Quantity
One of the key challenges in Market Basket Analysis is ensuring the quality and quantity of data. To derive meaningful insights, businesses need access to a substantial amount of transactional data. However, the quality of the data can be affected by errors, missing values, or inaccurate recording. It is crucial to address these data quality issues to ensure reliable analysis and accurate results.
Privacy and Ethical Considerations
Market Basket Analysis involves analyzing customer transactional data, which raises privacy and ethical considerations. Businesses must ensure that customer privacy is protected and that data is used in compliance with privacy regulations. Additionally, businesses should be transparent with customers about data collection and obtain proper consent. Respecting customer privacy and maintaining ethical practices build trust and credibility.
Complexity of Data Analysis
Performing Market Basket Analysis requires a certain level of expertise in data analysis techniques and algorithms. The process involves preprocessing, cleaning, and transforming data, setting appropriate support and confidence thresholds, and interpreting the results accurately. Overcoming the complexity of data analysis often requires a combination of technical skills, domain knowledge, and experience in using analytical tools like Tableau.
Changing Consumer Behavior
Market Basket Analysis relies on historical transactional data to identify patterns and associations. However, consumer behavior is not static and changes over time. Consumer preferences, trends, and purchasing habits can evolve, rendering certain association rules less relevant. Regular updating and fine-tuning of Market Basket Analysis models are necessary to adapt to changing customer behavior and ensure ongoing success.
Conclusion
Tableau Market Basket Analysis enables businesses to gain valuable insights into customer purchasing behavior, identify patterns and associations, and make data-driven decisions. By leveraging the power of Tableau, businesses can optimize product offerings, enhance cross-selling opportunities, and improve overall customer satisfaction. Market Basket Analysis in Tableau empowers organizations to stay competitive, drive revenue growth, and provide personalized experiences for their customers.


